Debugging a Django app in Visual Studio Code is quite straightforward. The setup just takes a few steps to configure. The only thing you really need to do is to create a debugger launch profile.
Open your project in Visual Studio code and under the "View" menu, select "Run". At the top, you'll see a popup which mentions "No Configurations":

When you open the dropdown menu, you can "Add a configuration". You can also click on the gear icon to get to the same menu:

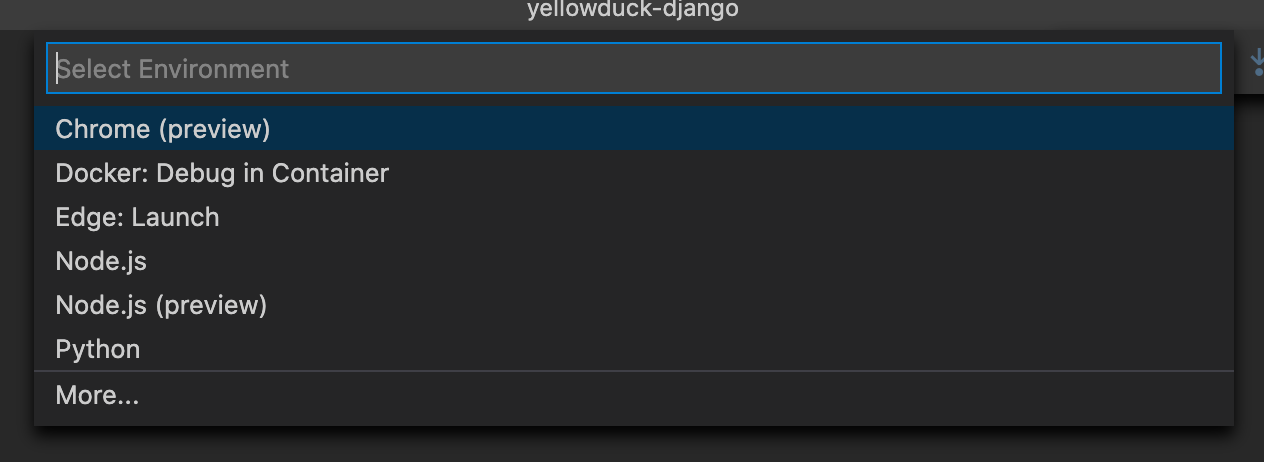
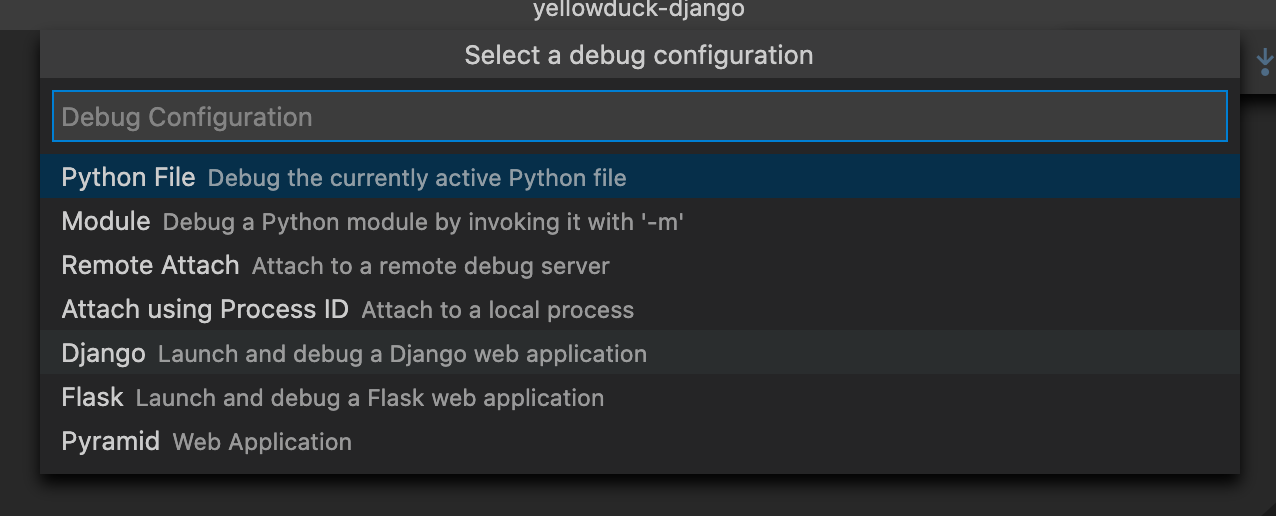
The next popup will ask you to select your environment. In our case, we'll select "Python" obviously. After the environment is selected, Visual Studio Code will allow you to select a specific Python debug configuration. Since we are configuring a Django application, we'll go ahead and select "Django" as the configuration:

After we did so, Visual Studio Code will add a file called .vscode/launch.json in the root of our project. This file contains a JSON string describing the debug configuration:
{
    "version": "0.2.0",
    "configurations": [
        {
            "name": "Python: Django",
            "type": "python",
            "request": "launch",
            "program": "${workspaceFolder}/manage.py",
            "args": [
                "runserver"
            ],
            "django": true
        }
    ]
}
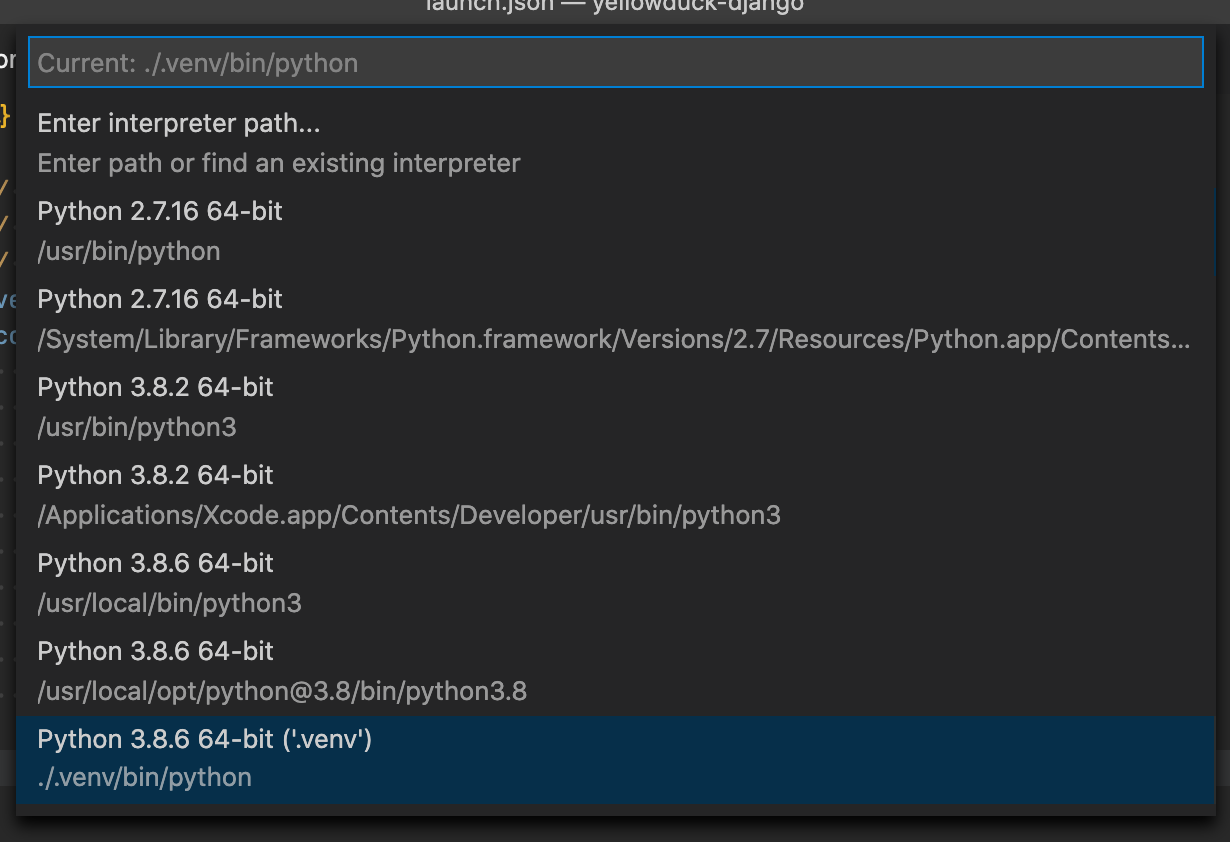
As you can see, the debugger will launch manage.py with the arguments ["runserver"]. It's also smart enough to known which python interpreter it needs to use to launch the app as that's configured in our project as well. If you are using a Python virtual environment, you need to make sure you have selected the correct python interpreter. If you are not sure, in the bottom toolbar of Visual Studio Code, you can see which intepreter is selected:

If you want to change it, you can click on it and select the correct one (in this case, we are selecting the one from the .venv folder):

This updates another Visual Studio Code configuration file in your project, .vscode/settings.json to be specific. The setting you alter by changing the python interpreter is python.pythonPath:
{
    "python.pythonPath": ".venv/bin/python",
    "files.exclude": {
        "**/.git": true,
        "**/.svn": true,
        "**/.hg": true,
        "**/CVS": true,
        "**/__pycache__": true,
        "**/.DS_Store": true,
    }
}
As you can see in the sample settings.json file, I've also defined files.exclude which lists all files which should be hidden in the Visual Studio file explorer.
To start debugging, you can set one or more breakpoints and run the debugger:

If you also have other (custom) Django manage commands you wish to debug, you can add them as extra debug configurations. In my blog for example, I have a custom management command called run_cronjobs. If I want to be able to debug that one as well, I can update the launch.json file to:
{
    "version": "0.2.0",
    "configurations": [
        {
            "name": "Python: Django",
            "type": "python",
            "request": "launch",
            "program": "${workspaceFolder}/manage.py",
            "args": [
                "runserver"
            ],
            "django": true
        },
        {
            "name": "Python: Cronjobs",
            "type": "python",
            "request": "launch",
            "program": "${workspaceFolder}/manage.py",
            "args": [
                "run_cronjobs"
            ],
            "django": true
        }
    ]
}
By doing so, I now how two separate debug configurations I can choose from depending on which command I would like to debug:

If you want to know more about debugging Django apps in Visual Studio Code, you can check the documentation.
If this post was enjoyable or useful for you, please share it! If you have comments, questions, or feedback, you can email my personal email. To get new posts, subscribe use the RSS feed.